
Analytics
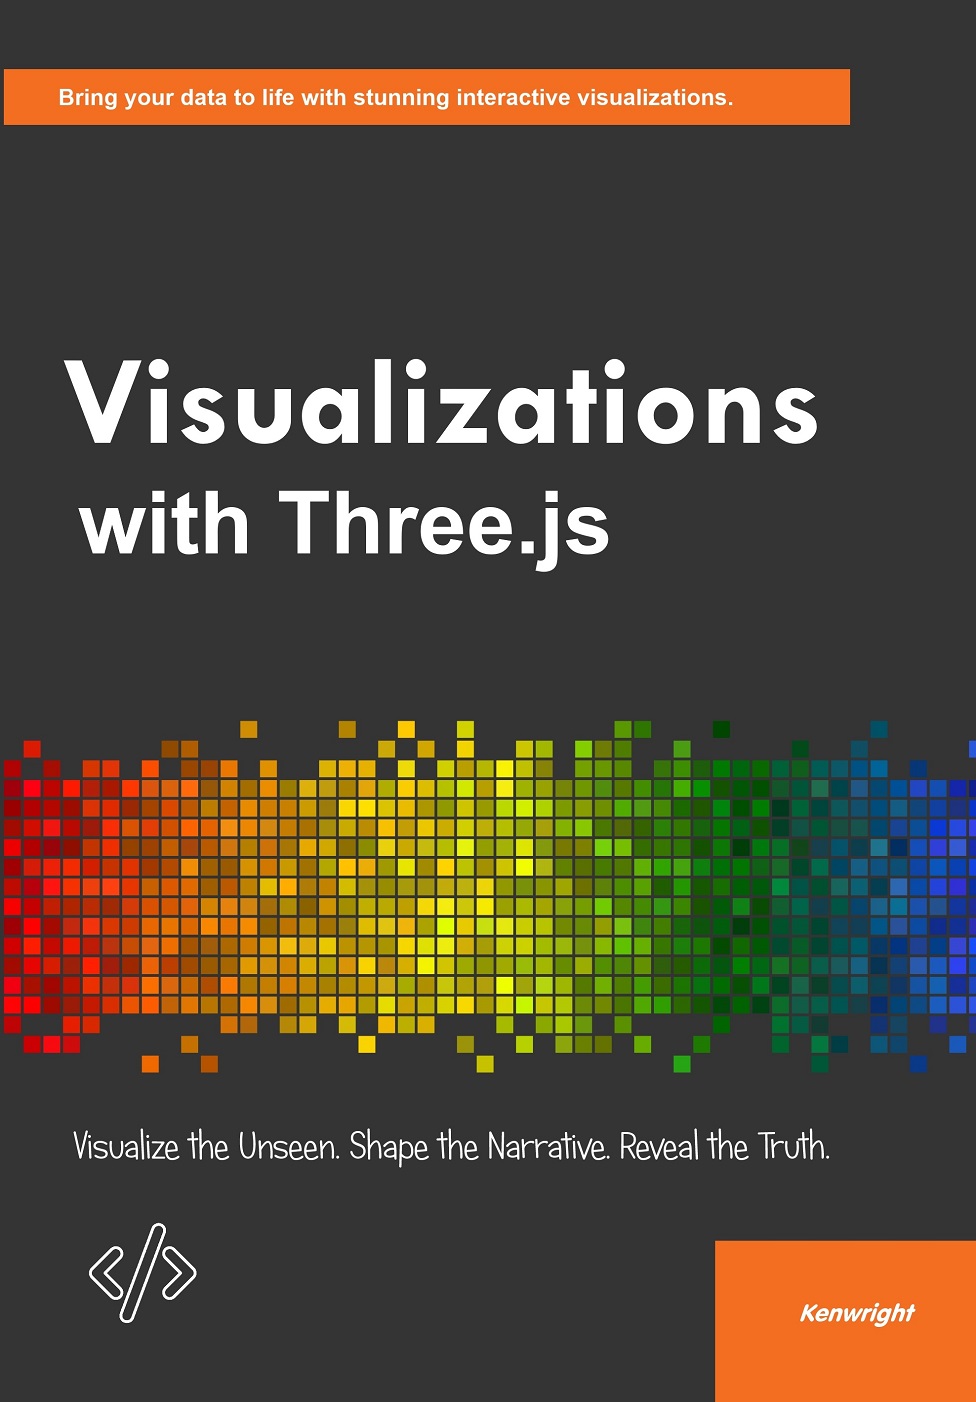
Visualizations with Three.js
Discover how to turn raw data into interactive 3D experiences using Three.js and JavaScript.
Learn how to build 3D visualizations using Three.js.
Brainwarming / THE CATALOGUE
Choose a question you would enjoy learning how to explain.
Try a topic plus an author, or use an ISBN for an edition. Need help choosing?
46 books matching “Interactive Charts”
Clear filters
Discover how to turn raw data into interactive 3D experiences using Three.js and JavaScript.
Learn how to build 3D visualizations using Three.js.
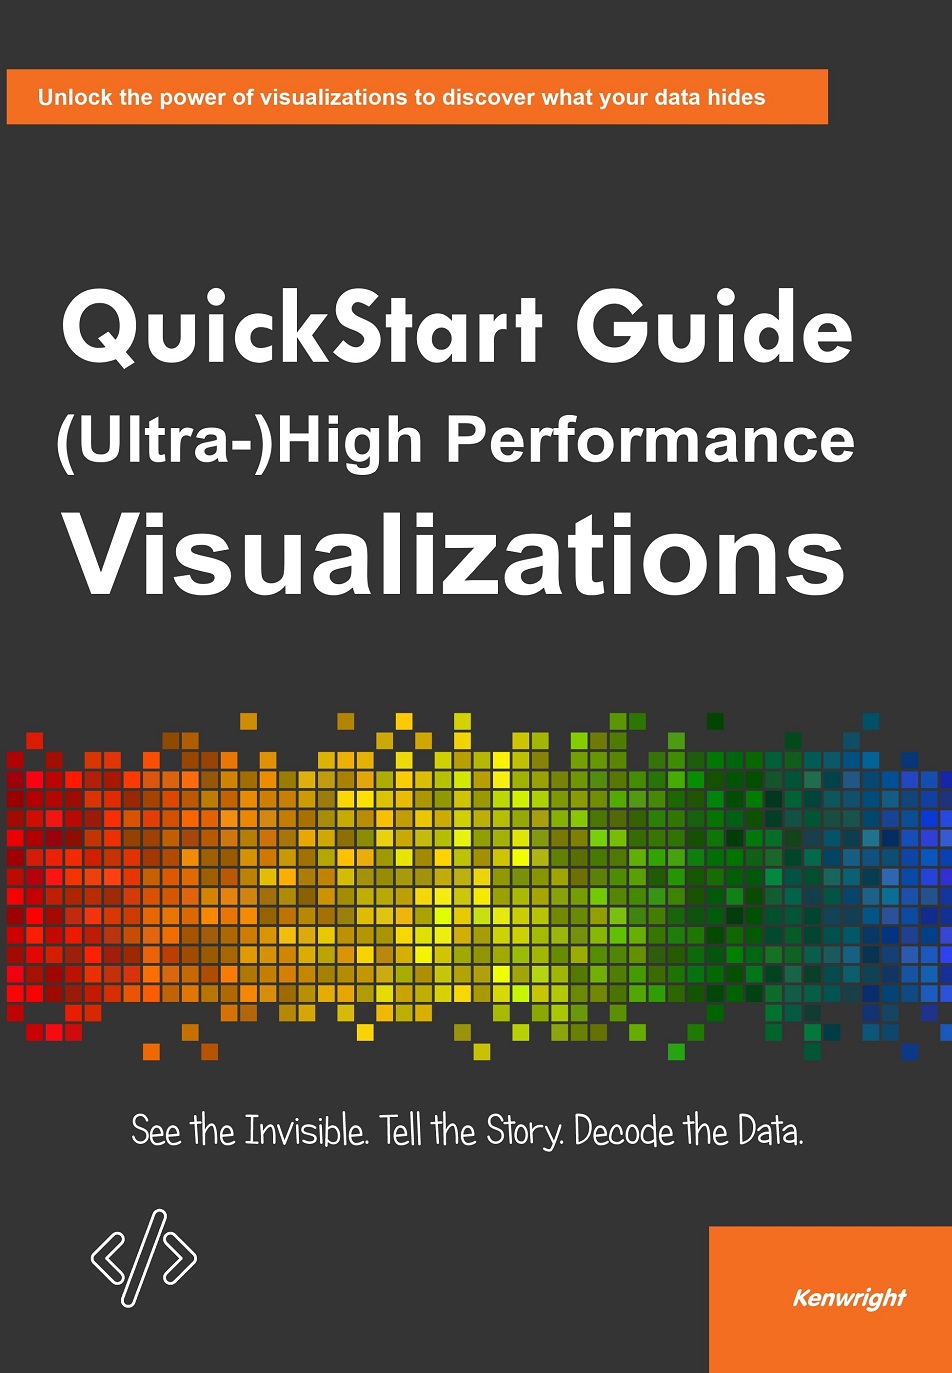
Build visualizations that scale with your data—and your ambition.
Create scalable, interactive visualizations.
Choose a question you would enjoy learning how to explain.