Brainwarming / THE CATALOGUE
Explore the books
Choose a question you would enjoy learning how to explain.
Try a topic plus an author, or use an ISBN for an edition. Need help choosing?
Computers & Technology
Kenwright
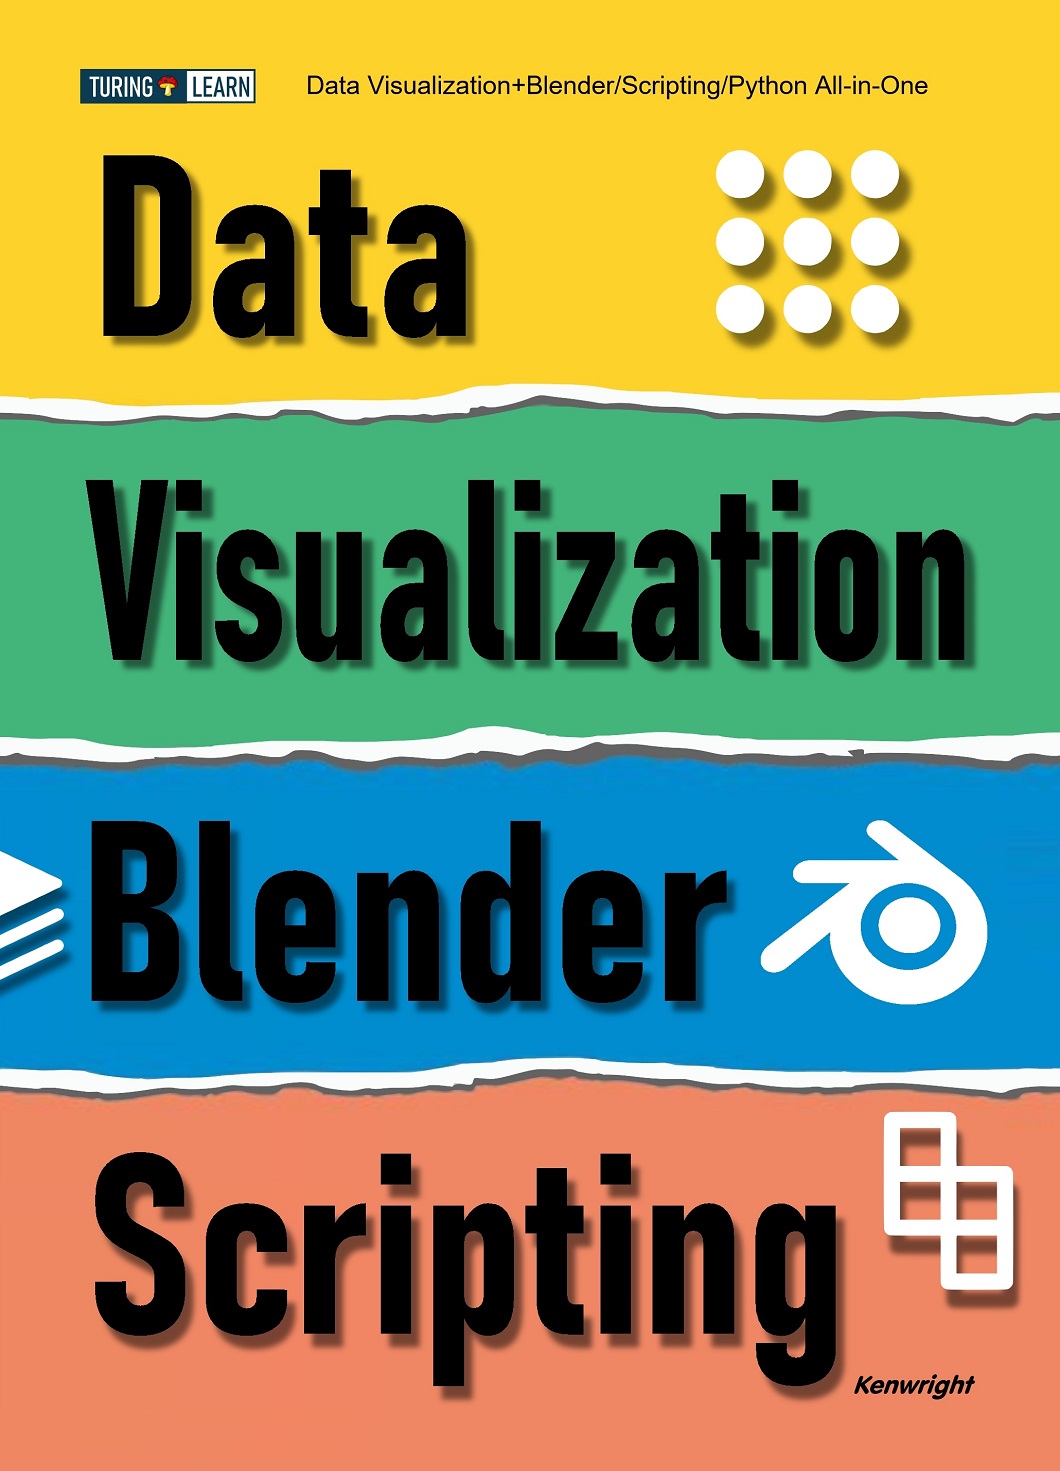
Create immersive data visualizations using Blender and Python scripting—no artistic skills required.
↳ Learn to script Blender with Python for data visualization.
Analytics
Kenwright
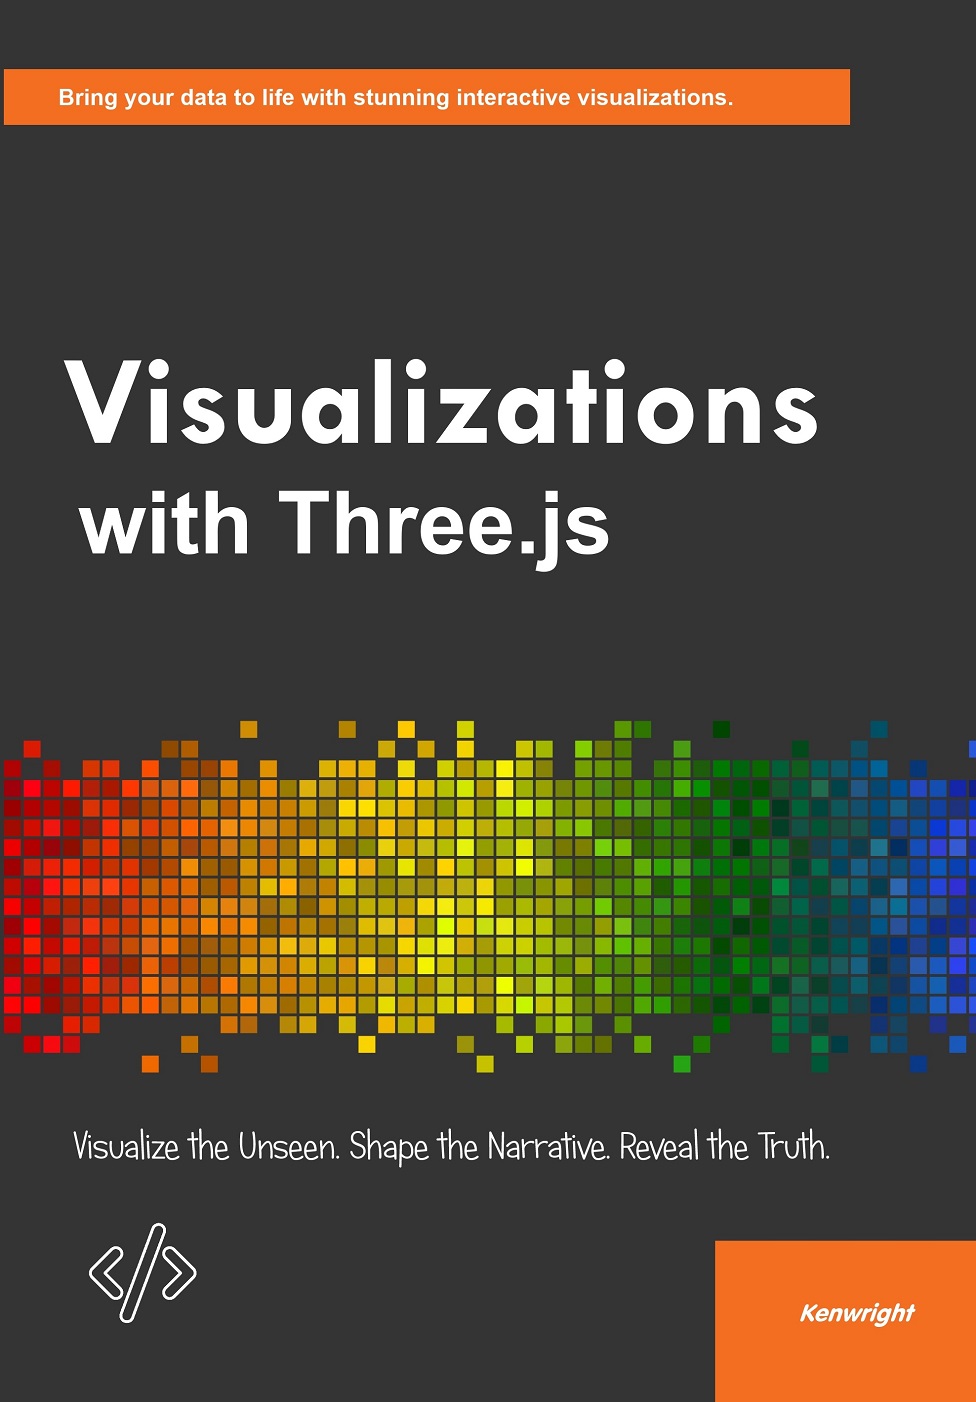
Discover how to turn raw data into interactive 3D experiences using Three.js and JavaScript.
↳ Learn how to build 3D visualizations using Three.js.
Books
Kenwright
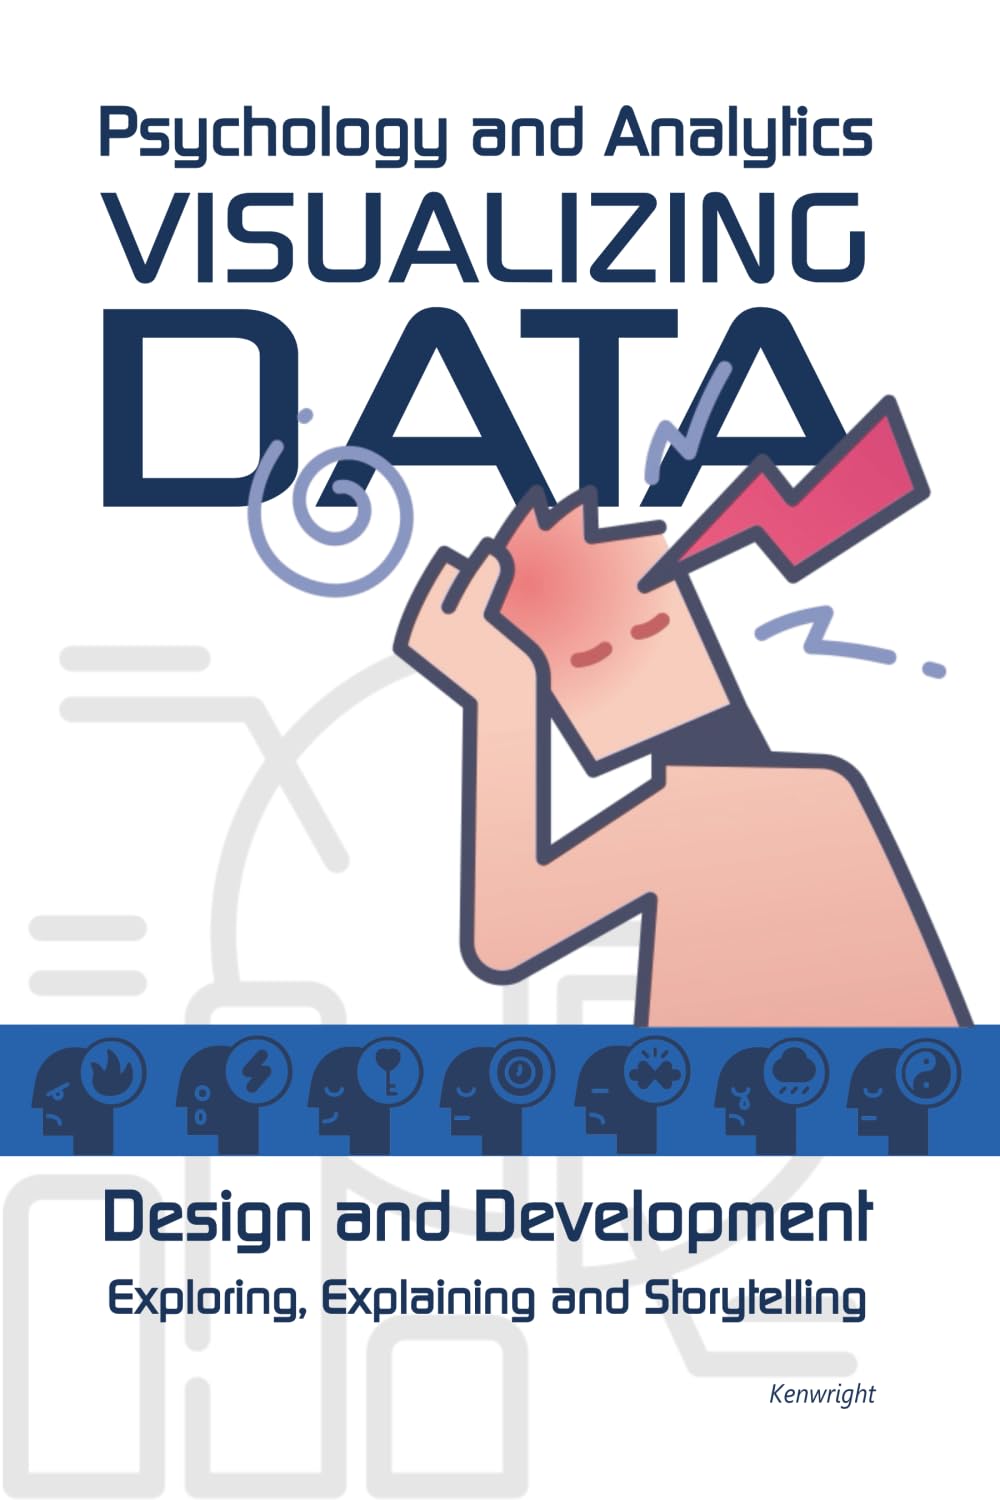
Understand how visualizations influence perception and decision-making through psychological and analytical lenses.
↳ Learn the psychology behind effective visuals.
Computers & Technology
Kenwright
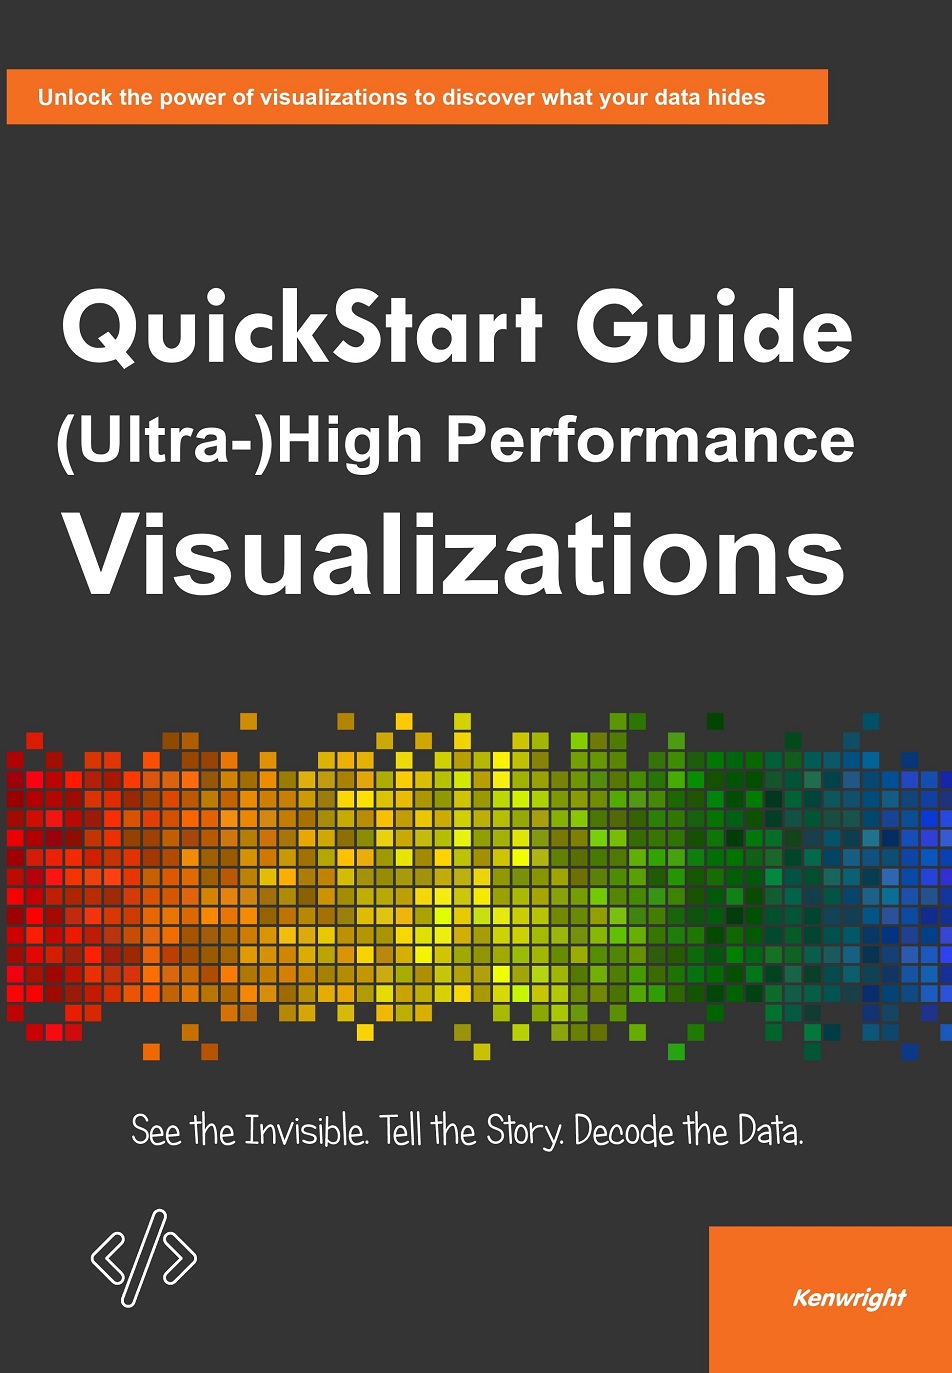
Build visualizations that scale with your data—and your ambition.
↳ Create scalable, interactive visualizations.
Analytics
Kenwright
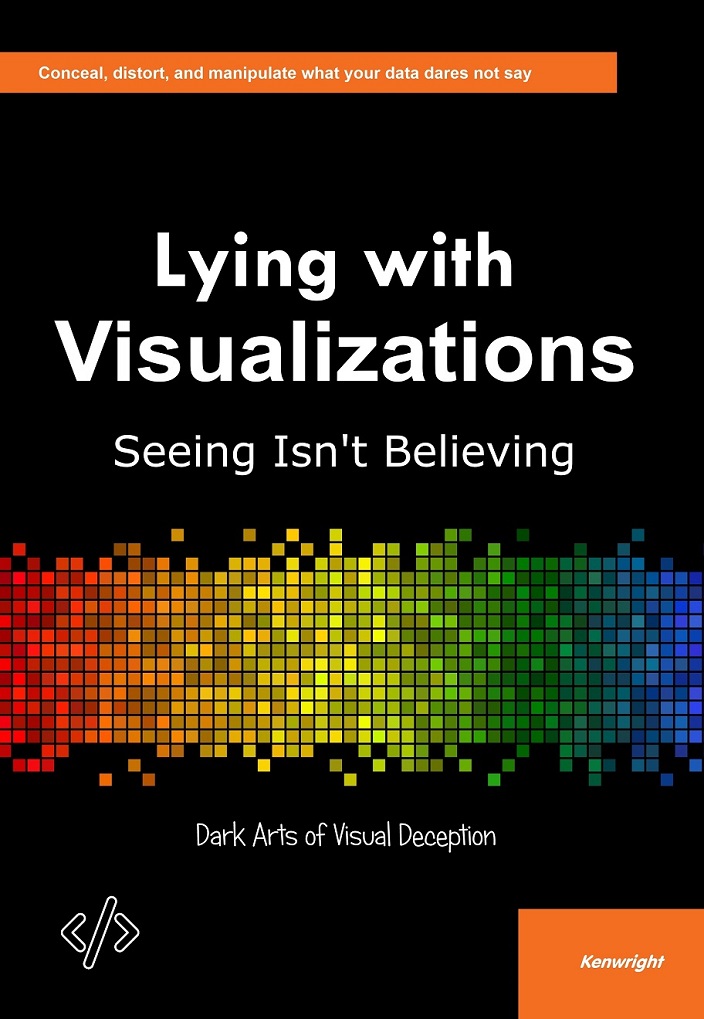
Learn how charts, graphs, and infographics can be used to deceive - and how to spot the lies.
↳ Identify common techniques used to mislead with visualizations.
A small spark.
A bigger question.
Choose a question you would enjoy learning how to explain.
